LEADERS

TOP International LEADERS Calling Market Crashes Years Ahead
Second to None, Anywhere...

'Warned 2000 tech slide; predicted 2008 meltdown in 2007. Forecasted 2020 global economic collapse in 2011, AND NOW- BY 2050 - THE MOTHER OF ALL CRASHES"

Featured post

A #TALE OF TWO CITIES - #ECONOMICS AND #SCIENCE COLLIDE

  SURREAL ECONOMICS OR CONCRETE SCIENCE? ORIGINAL POST It  was the best of times, it was the worst of times, it was the age of wisdom, it wa...

Think, act ,lead

Search This Blog

HUGE SAVINGS ON HOT NEW ITEMS

Sunday 28 April 2019

#Oil Shock Looms As #Saudi Ghawar Field Fading Fast

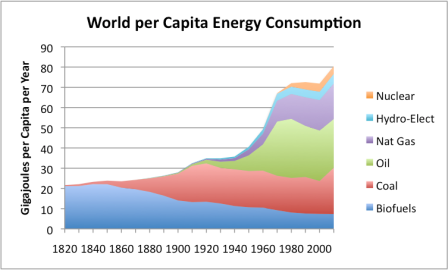
"about a fifth of the total -- had been drilled so systematically over nearly a century that more than 40 percent of their oil has been already extracted, a considerable figure for an industry that usually struggles to recover more than half the barrels in place underground."Image result for ghawar oil field


The biggest Saudi oil field is fading faster than anyone guessed


It was a state secret and the source of a kingdom’s riches. It was so important that U.S. military planners once debated how to seize it by force. For oil traders, it was a source of endless speculation.

Now the market finally knows: Ghawar in Saudi Arabia, the world’s largest conventional oil field, can produce a lot less than almost anyone believed.
`

When Saudi Aramco on Monday published its first ever profit figures since its nationalization nearly 40 years ago, it also lifted the veil of secrecy around its mega oil fields. The company’s bond prospectus revealed that Ghawar is able to pump a maximum of 3.8 million barrels a day -- well below the more than 5 million that had become conventional wisdom in the market.Image result for ghawar oil field production


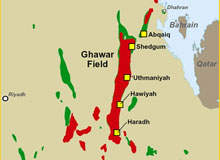
"As Saudi’s largest field, a surprisingly low production capacity figure from Ghawar is the stand-out of the report," said Virendra Chauhan, head of upstream at consultant Energy Aspects Ltd. in Singapore.


Read More

LEARN MORE


WHAT IS SAUDI ARAMCO?


Sunday 21 April 2019

#OVERPOPULATION LEADS TO UNSUSTAINABLE #ENERGY FUTURE


World Energy Consumption Since 1820 in Charts


Figure 1 (above) shows the huge increase in world energy consumption that has taken place in roughly the last 200 years. This rise in energy consumption is primarily from increased fossil fuel use. Below is the population increase.

Image result for population increase since 1820

With energy consumption rising as rapidly as shown in Figure 1, it is hard to see what is happening when viewed at the level of the individual. To get a different view, Figure 3 shows average consumption per person, using world population estimates by Angus Maddison.


On a per capita basis, there is a huge spurt of growth between World War II and 1970. There is also a small spurt about the time of World War I, and a new spurt in growth recently, as a result of growing coal usage in Asia.


LEARN MORE

POPULATION GROWTH IS UNSUSTAINABLE


Dream, Believe, Inspire