Chart Patterns Indicate Texas Oil Production Facing Peak
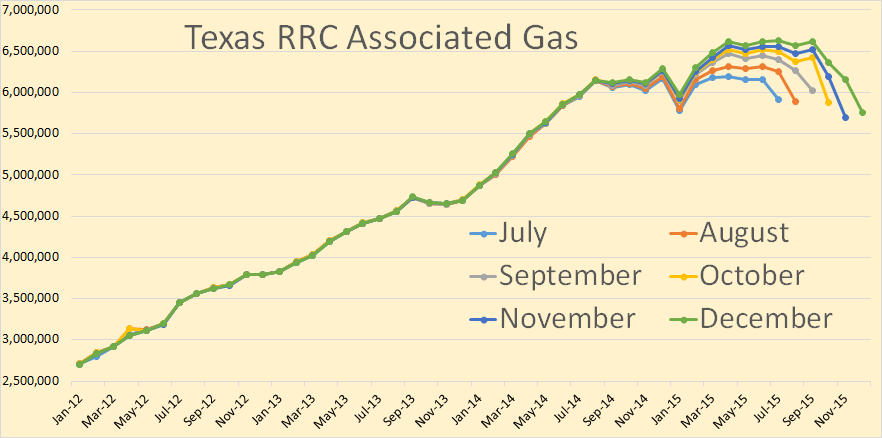
The Texas RRC Oil and Gas Production Data is out. There appeared to be no decline in December production and may have even been a slight increase.
The Texas RRC data is incomplete and only gives an indication as to whether Texas production increased or decreased. The data appears to droop because each month the the Texas Railroad Commission receives a little more data and the totals increase, little by little, month by month, until after many months the data is complete.
In our charts we posted over the past six months of data in order to give some indication as to whether production is increasing or decreasing. The final data is through December and the EIA data is through November.
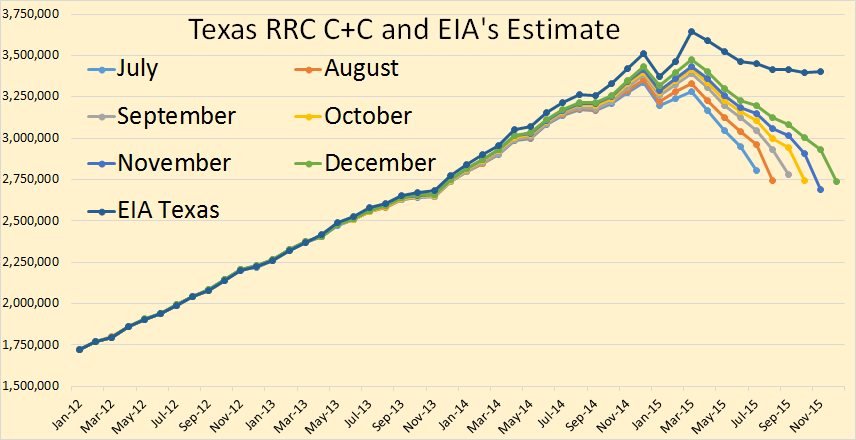
Texas crude plus condensate declined a little in November but seemed to make up that decline in December. Total Texas C+C seems to be on a flat plateau, declining in Eagle Ford but making up that decline in the Permian and the rest of Texas.

The EIA estimates the final Texas data through November. They have Texas peaking in March and down about a quarter of a million barrels per day since that point.
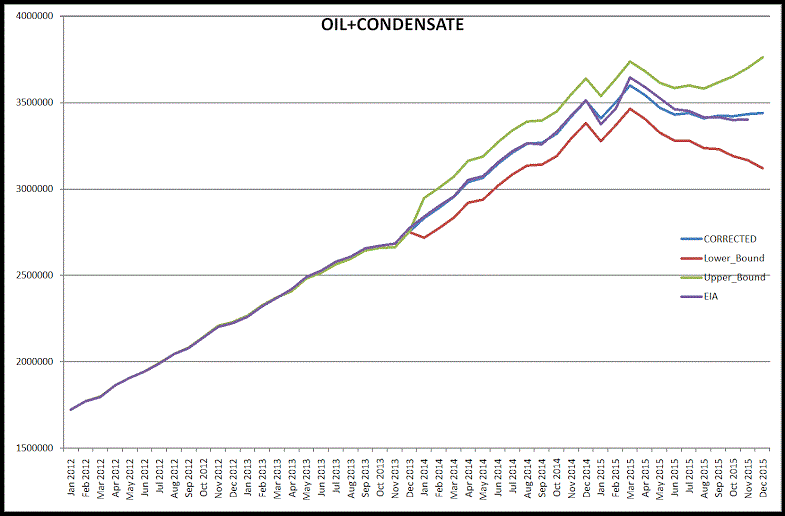
Dr. Dean Fantazzini, Deputy Head of the Chair of Econometrics and Mathematical Methods in Economics at the Moscow School of Economics, Moscow State University, has worked out an algorithm that predicts what the final production numbers will look like. He has C+C relatively flat the last few months and slightly above the EIA estimate.


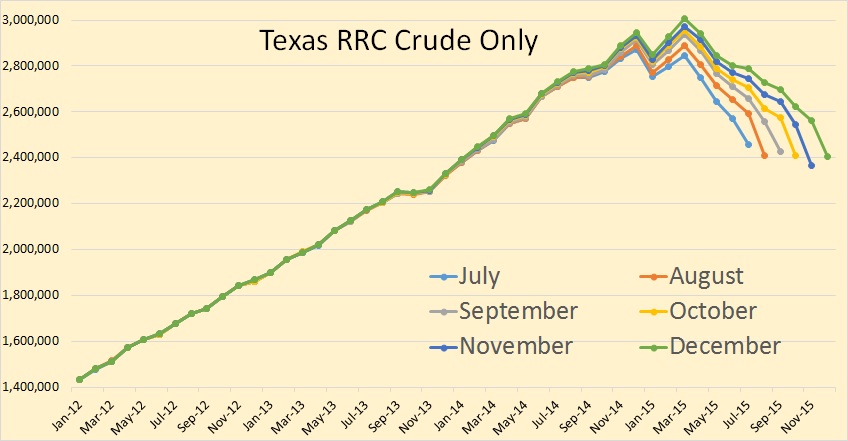
Texas crude only shows basically the same pattern as C+C.
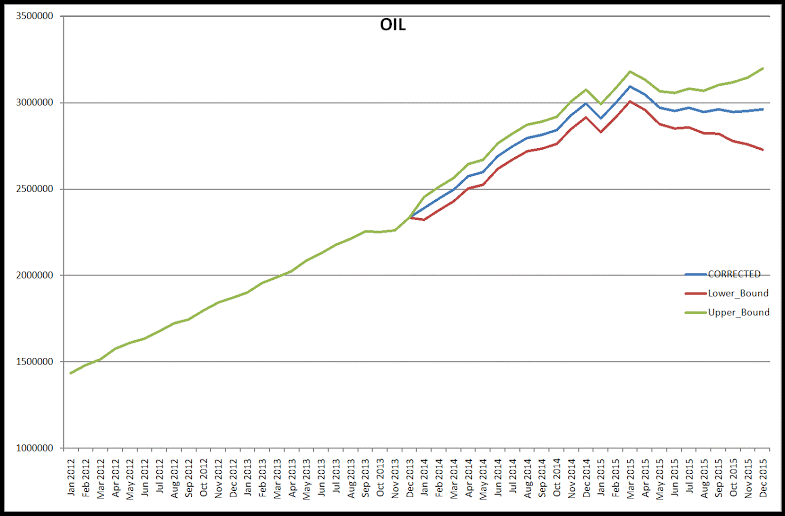
This is Moscow's estimate of what the final Texas crude only production will look like.
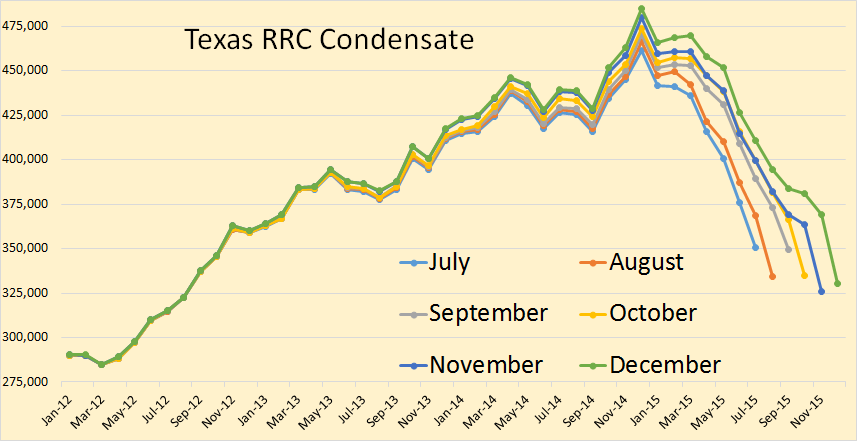
Texas condensate seems to have a slightly steeper decline than does crude only and peaked in December rather than March when crude only peaked. we use the term “peaked” to mean “peaked so far” and we are not asserting that it is the final peak. Only time will tell whether it is the final peak or not.
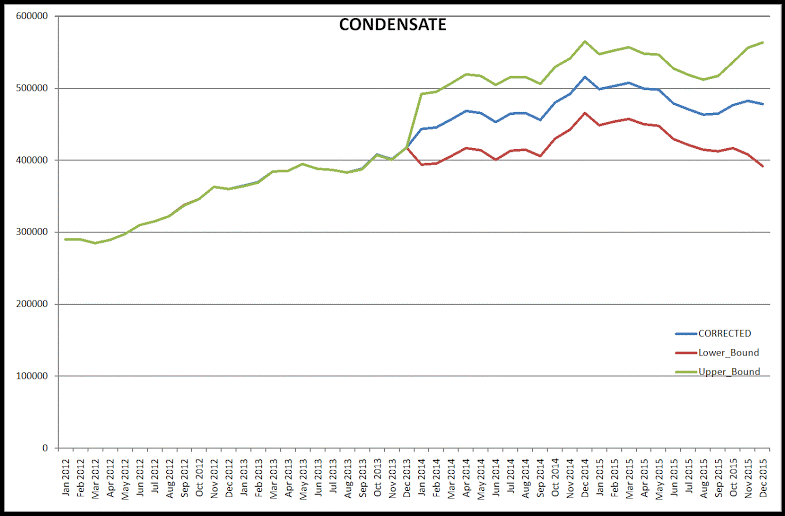
The Russian data agrees that condensate peaked in December.
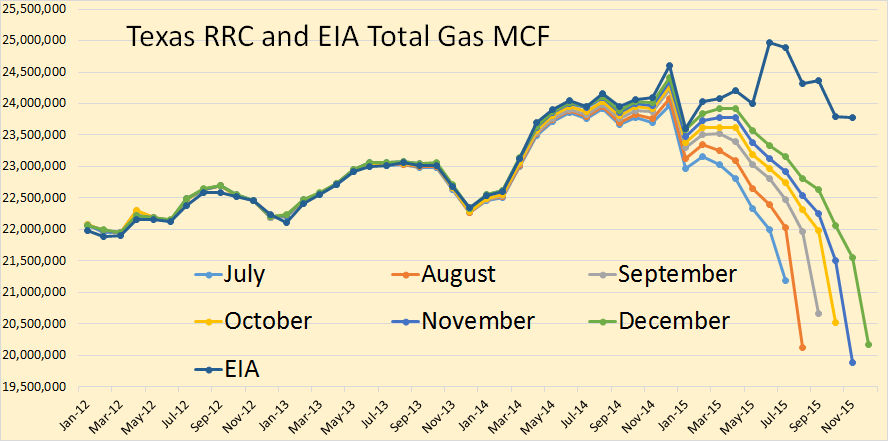
Texas total gas production, according to the EIA, peaked in June, so far, and now seems to be declining a bit faster than oil.
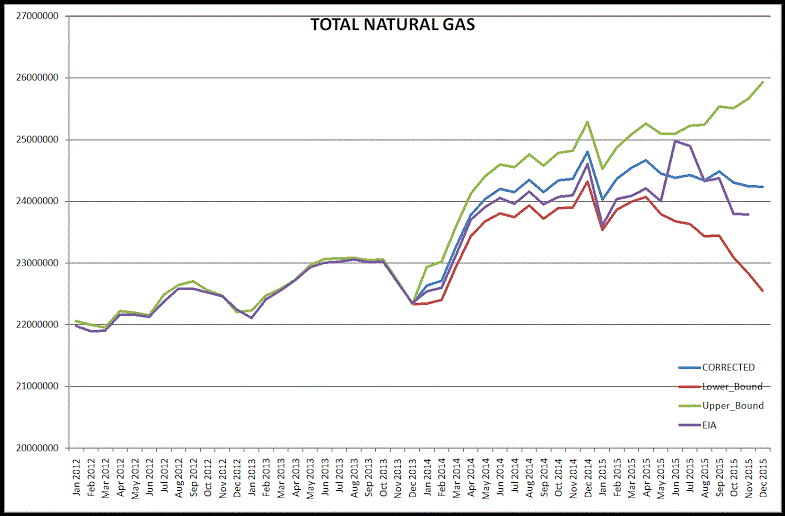
Russian numbers shows Texas total gas production on a plateau with a slow decline. He has Texas gas production, in November, slightly above the EIA’s estimate.
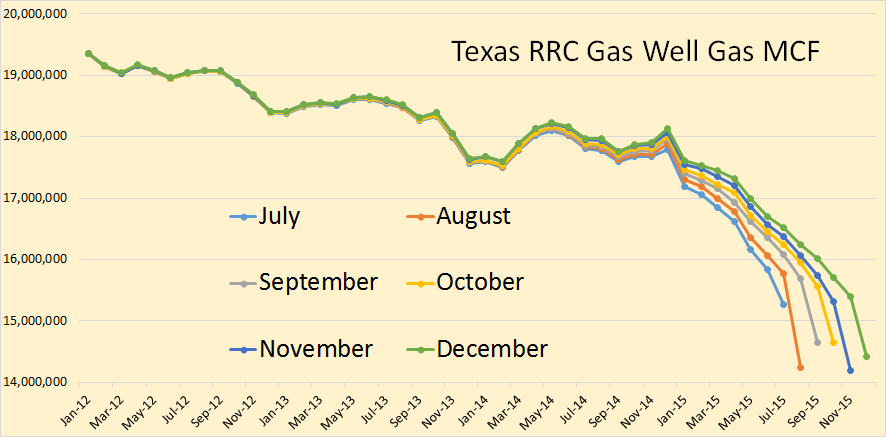
Texas gas well gas actually peaked in early 2009 and has since been in a slow but steady decline.

Texas gas production has been kept increasing by the increase of associated gas. The shale oil boom is largely responsible for the increase in Texas associated gas.
- Mahjoub Mohamed Salih, WNN News


No comments:
Post a Comment