LEADERS

TOP International LEADERS Calling Market Crashes Years Ahead
Second to None, Anywhere...

'Warned 2000 tech slide; predicted 2008 meltdown in 2007. Forecasted 2020 global economic collapse in 2011, AND NOW- BY 2050 - THE MOTHER OF ALL CRASHES"

Featured post

A #TALE OF TWO CITIES - #ECONOMICS AND #SCIENCE COLLIDE

  SURREAL ECONOMICS OR CONCRETE SCIENCE? ORIGINAL POST It  was the best of times, it was the worst of times, it was the age of wisdom, it wa...

Think, act ,lead

Search This Blog

HUGE SAVINGS ON HOT NEW ITEMS

Saturday 27 February 2016

Bad News - Texas Oil Production Peaking?


 Chart Patterns  Indicate Texas Oil Production Facing Peak

Texas Assciated Gas
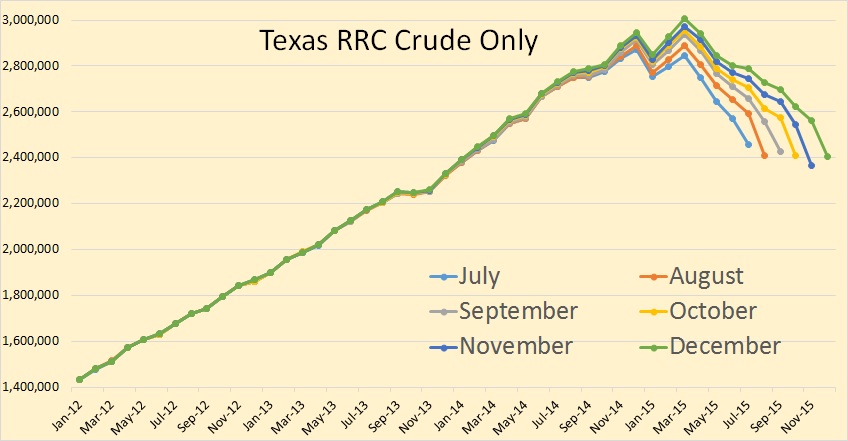
The Texas RRC Oil and Gas Production Data is out. There appeared to be no decline in December production and may have even been a slight increase. 
The Texas RRC data is incomplete and only gives an indication as to whether Texas production increased or decreased. The data appears to droop because each month the the Texas Railroad Commission receives a little more data and the totals increase, little by little, month by month, until after many months the data is complete.
In our  charts we posted over the past six months of data in order to give some indication as to whether production is increasing or decreasing. The final data is through December and the EIA data is through November.
Texas C+C
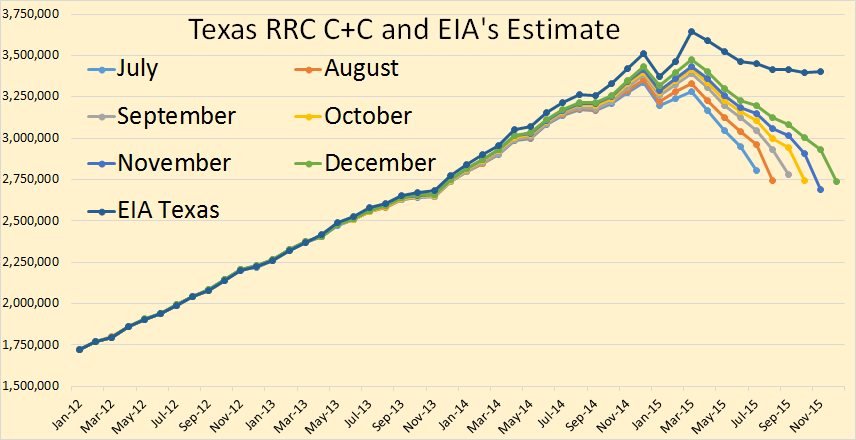
Texas crude plus condensate declined a little in November but seemed to make up that decline in December. Total Texas C+C seems to be on a flat plateau, declining in Eagle Ford but making up that decline in the Permian and the rest of Texas.


Image result for eagle ford drilling


The EIA estimates the final Texas data through November. They have Texas peaking in March and down about a quarter of a million barrels per day since that point.
Dean C+C
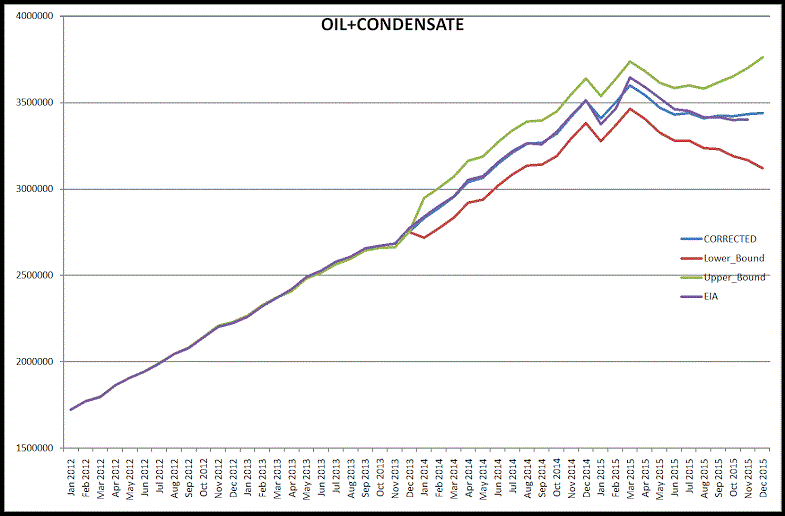
Dr. Dean Fantazzini, Deputy Head of the  Chair of Econometrics and Mathematical Methods in Economics at the Moscow School of Economics, Moscow State University, has worked out an algorithm that predicts what the final production numbers will look like. He has C+C relatively flat the last few months and slightly above the EIA estimate.


Texas Crude Only

Texas crude only shows basically the same pattern as C+C.
Dean Oil

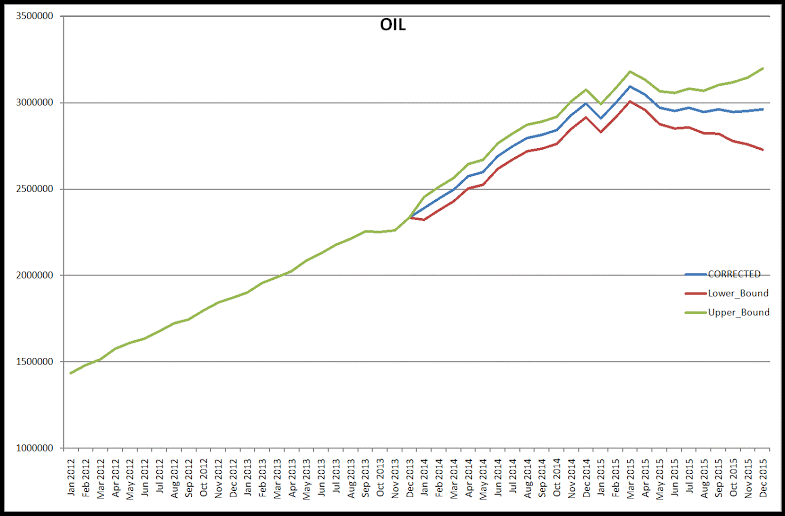
This is  Moscow's estimate of what the final Texas crude only production will look like.
Texas Condensate

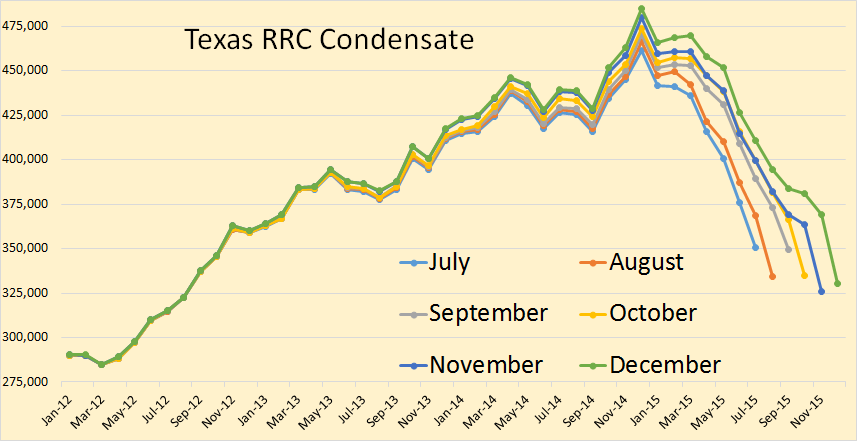
Texas condensate seems to have a slightly steeper decline than does crude only and peaked in December rather than March when crude only peaked. we use the term “peaked” to mean “peaked so far” and we are  not  asserting that it is the final peak. Only time will tell whether it is the final peak or not.
Dean Condensate

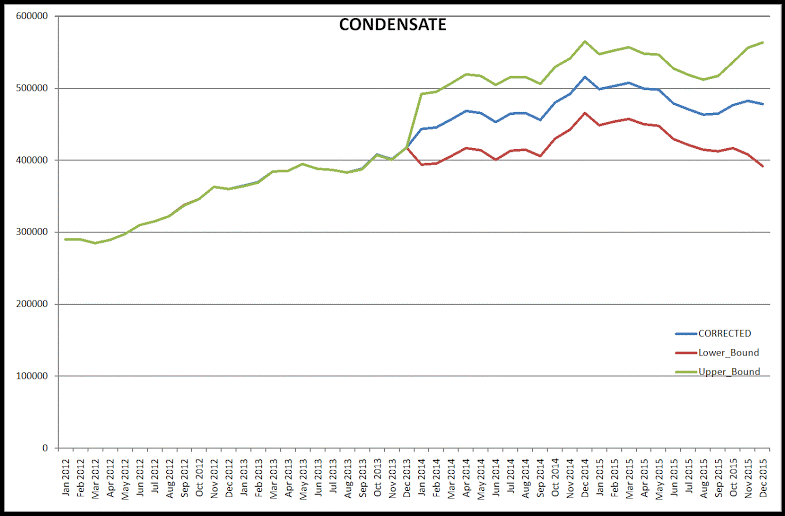
  The Russian data agrees that condensate peaked in December.
Texas Total Gas
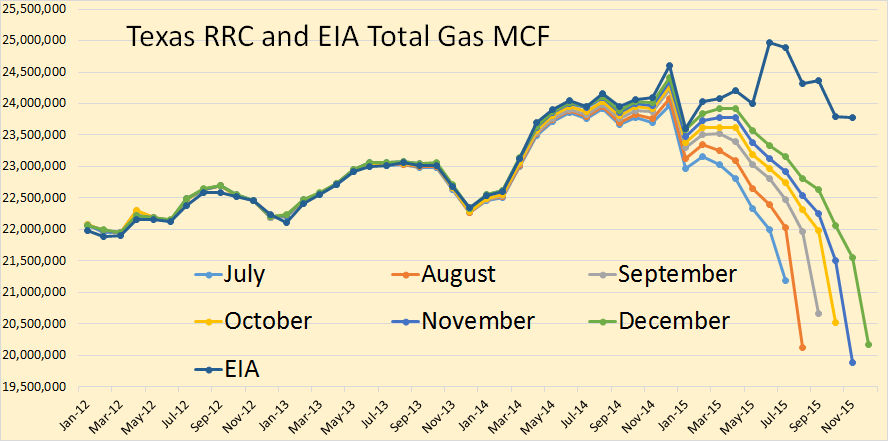
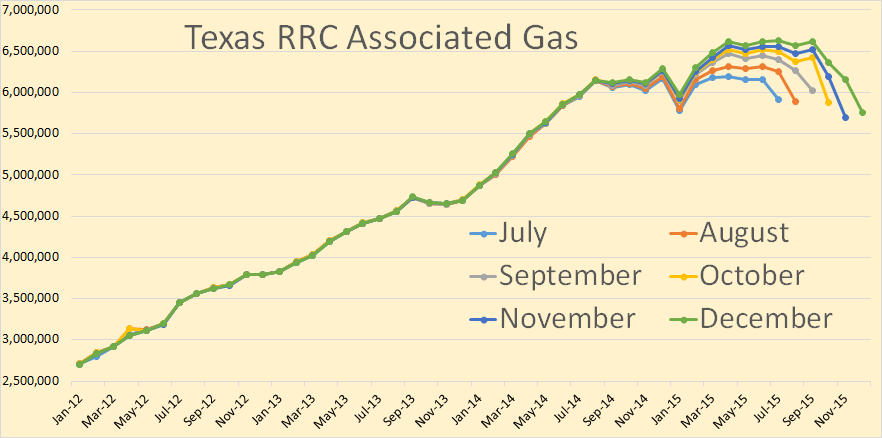
Texas total gas production, according to the EIA, peaked in June, so far, and now seems to be declining a bit faster than oil.
Dean Gas
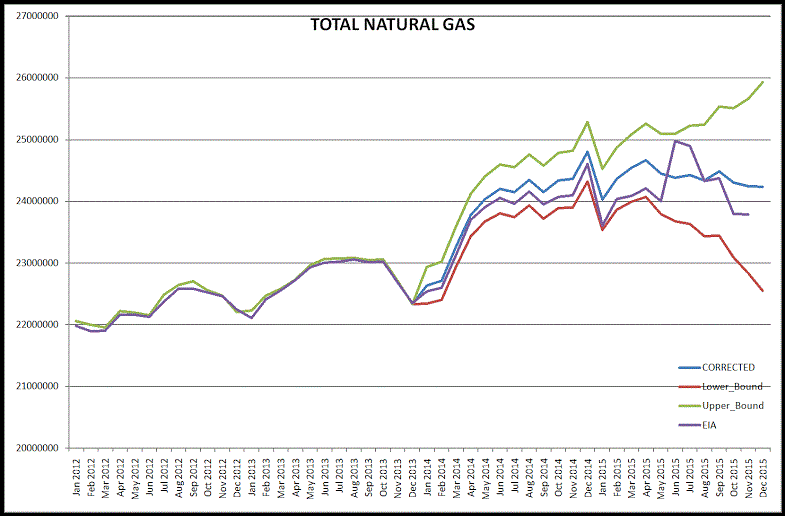
 Russian numbers  shows Texas total gas production on a plateau with a slow decline. He has Texas gas production, in November, slightly above the EIA’s estimate.
Texas Gas Well Gas
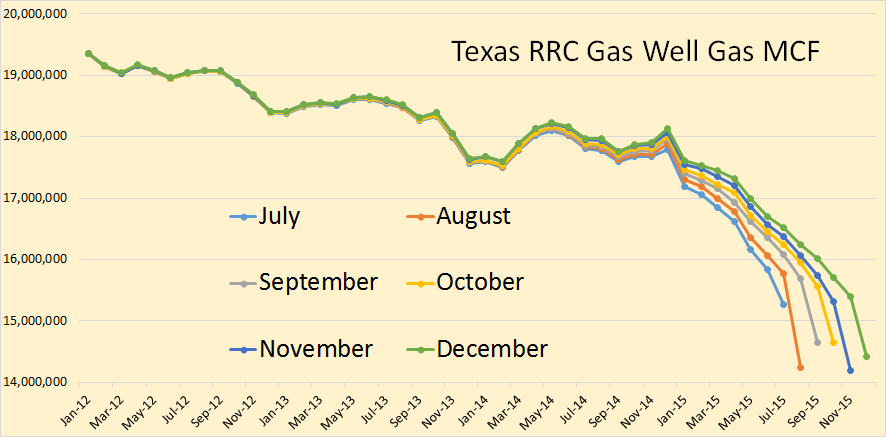
Texas gas well gas actually peaked in early 2009 and has since been in a slow but steady decline.
Texas Assciated Gas
Texas gas production has been kept increasing by the increase of associated gas. The shale oil boom is largely responsible for the increase in Texas associated gas. 

  • Mahjoub Mohamed Salih, WNN News


Friday 26 February 2016

Energy 2050 Apocalypse - The Road to Exhaustion (Part 7)

Energy 2050 Apocalypse


World Energy to 2050
  Forty Years of Decline
Effects and Conclusion
Part 7


The Effect of Energy Decline on the World's Population


World Population Estimate


In order to assess the impact of declining energy supplies on the world's future population, we first need to establish what that population will be.

In the past I have argued that a drastic reduction in the world's population was likely over the course of the coming century.  That expectation was based on my estimate of the impact of energy shortages, fresh water depletion, soil fertility depletion, the decimation of oceanic fish stocks, pollution, biodiversity loss, climate change and economic disruption.  It is very hard to make that case, however - not because the problems I list aren't apparent, but because the causal links to human population decline are very difficult to establish conclusively.

Accordingly, for this analysis I have adopted the generally accepted population projection published by the United Nations: a decreasing rate of growth to a population of about 9 billion in 2050. This projection is known as the Medium Fertility Case.  As you can see from the graph in Figure 15 it matches perfectly with the projected trend of actual population growth over the last 20 years.


Figure 15: Actual and projected World Population Growth, 1985  to 2050


The Effect on Average Per Capita Energy


One of the interesting, though very high-level, ways to measure of global wealth is to calculate the average energy available to each person on earth.  While the resulting per capita average doesn't reflect the disparity between rich and poor individuals or nations or let us know what sorts of things people might do with their energy endowments, it can give us a general feeling for how "energy-wealthy" the average global citizen is, especially compared to other times.
Fortunately, the energy analysis we have just completed gives us the tool we need to establish this measure.  By simply dividing the total energy available in each year by that year's population we can construct the graph shown in Figure 16.


Figure 16: Global Average Per Capita Energy Consumption, 1965 to 2050

As you can see, the rising population and falling energy supply combine to produce a falling per capita energy curve.  In fact, if these models of energy and population are correct, we can expect to see a drop of almost 50%  in average per capita energy by 2050, from 1.7 toe/person to 0.9 toe/person.  Each person alive in 2050 will have available, on average, only half the energy they would have today.

The Effect on Countries


Unfortunately the world is not a uniform place, and measures like "average per capita energy" don't really tell us much about how the world might look in 2050.  To gain a bit more insight it is helpful to think of the world as being composed of rich and poor nations, where their wealth is characterized by their total energy consumption and whose population growth is expressed in their Total Fertility Rate.

An interesting insight appears when you sort the world's nations by their per capita energy consumption.  The nations and regions at the bottom of the consumption scale (Africa, Bangladesh, India, Pakistan, Peru, Indonesia and much of Southeast Asia) all have very high fertility rates, well over the replacement rate of 2.1 children per woman.  In fact, when normalized for population size, the average TFR of the poor nations is 3.0.  In contrast, the group containing all the other nations is well below the replacement fertility rate at around 1.8.

The implication is that poor nations are going to face double jeopardy.  Their populations will increase even as their already low energy consumption drops further.  In addition, as per capita energy consumption drops world-wide, some nations that are not currently considered "energy-poor" will be impoverished enough to join the group at the bottom, thereby swelling its ranks even further.

The Growing Divide Between Rich and Poor


In order to get some idea of the magnitude of this effect, I have associated each of the 63 countries or regional groupings in this analysis with their current population, total current energy consumption and their population in 2050.  I have arbitrarily decided that a per capita consumption of 0.75 toe/yr is the dividing line between between poverty and wealth.  0.75 toe/yr is a bit less than half the present world average, and only one tenth of the energy consumed by an average American.


The countries and regions that currently fall below that poverty line include Bangladesh, Philippines, Pakistan, India, Peru, Indonesia, Ecuador, Colombia, Egypt, much of Africa, many Asian Pacific nations and some Eurasian countries.  Altogether they have a  population of about 3 billion people.  The rest of the world's nations, from Algeria to Kuwait, are in the rich half of 3.5 billion people.

In order to assess the effect of declining average per capita income, I decided to spread the pain evenly.  The assumption is that most countries will see a similar drop in their level of energy consumption.  While that expectation may not be completely realistic, it seems close enough for the purpose of this exercise.  The result is that countries with a per capita consumption between 0.75 and 1.5 toe/person will lose enough energy to be counted in the group of poor nations.
The countries and regions that drop from rich to poor status include Algeria, Turkey, Mexico, Thailand, much of Central and South America, the non-oil-producing nations of the Middle East, and - most significantly - China.

When we add up the populations in 2050 of the rich nations that are left, it comes out to only 1.6 billion.  Remember, their populations fell due to lower fertility, there are fewer of them and they lost China to the ranks of the poor.

The population of the poor nations is where the shock comes.  Their total population in 2050 adds up to over 7 billion people.  That number is more than the total population of the Earth today, all living at an energy level somewhere between Bangladesh and Egypt.


Figure 17: World Population at low and high energy consumption levels, today and 2050


Conclusion


How many ways are there to say the world is heading for hard times?  Losing most of our oil is bad enough, and losing most of our gas as well borders on the catastrophic. Combining these losses with the exponential growth of those nations that can least afford it is nothing short of cataclysmic.  The ramifications spread out like ripples on a pond.  There will be 7 billion people who will need fertilizer and irrigation water to survive, but would be too poor to buy it even at today's prices.  Given the probable escalation in the costs of fertilizer and the diesel fuel or electricity for their water pumps, it isn't hard to understand why the spread of famine in energy-poor regions of the world seems virtually inevitable.

In normal times the poor would appeal to the rest of the world for food aid.  However, these times may be anything but normal.  Even the shrinking population of the rich world will see its wealth eroded by the drop in energy supplies and the increasing cost of producing the energy they do have. This decline in their wealth will in turn erode any surpluses they might otherwise have donated to international aid.  In any event, there will be over twice as many hungry mouths crying for that aid, with less and less of it available.

This assessment doesn't even consider the converging and amplifying impacts of the other problems I mentioned above: the loss of soil fertility and fresh water, the death of the oceans, rising pollution, spreading extinctions and accelerating climate change.

The solution to this dilemma, if solution there may be, does not seem to lie in some Deus ex Machina or in a technological revision of the parable of the loaves and fishes.  If the dark visions outlined in this article come true, we will be faced with a world in which the only way forward is to accept that Mother Nature does not negotiate.  We must use our considerable intelligence to figure out ways to live within the ecological budget we have been allotted.  More than that, we must change our values away from our current paradigm of growth, competition and exploitation to one of sustainability, cooperation and nurturing.  The longer and tighter we cling to our present ways, the more damage we will ultimately inflict on ourselves and the world we live in.  For many, the time for such a change has already passed.  For a fortunate few there may yet be enough time to move toward the new ways of living and being that will be required in this brave new world.


The End.

Free Logo From Thefreelogomakers.com


Saturday 20 February 2016

The Great Global Famine - Aftermath to Peak Oil

The Coming Famine

By Peter Goodchild

http://www.survivepeakoil.blogspot.ca/2016/02/the-coming-famine.html


Humanity has struggled to survive through the millennia in terms of Nature's tendency to balance population size with food supply. The same is true now, but population numbers have been soaring for over a century. Oil, the limiting factor, is close to or beyond its peak extraction. Without ample, free-flowing oil, it will not be possible to support a population of several billion for long. Without fossil fuels for fertilizer and pesticides, as well as for cultivating and harvesting, crop yields drop by more than two-thirds (Pimentel, 1984; Pimentel & Hall, 1984; Pimentel & Pimentel, 2007).


Over the next few decades, there will be famine on a scale many times larger than ever before in human history. It is possible, of course, that warfare and plague, for example, will take their toll to a large extent before famine claims its victims. The distinctions, in any case, can never be absolute: often "war + drought = famine" (Devereux, 2000, p. 15), especially in sub-Saharan Africa, but there are several other combinations of factors.


Although, when discussing theories of famine, economists generally use the term "neo-malthusian" in a derogatory manner, the coming famine will be very much a case of an imbalance between population and resources. The ultimate cause will be fossil-fuel depletion, not government policy (as in the days of Stalin or Mao), warfare, ethnic discrimination, bad weather, poor methods of distribution, inadequate transportation, livestock diseases, or any of the other variables that have often turned mere hunger into genuine starvation.


The increase in the world’s population has followed a simple curve: from about 1.7 billion in 1900 to over 7 billion today. A quick glance at a chart of world population growth, on a broader time scale, shows a line that runs almost horizontally for thousands of years, and then makes an almost vertical ascent as it approaches the present. That is not just an amusing curiosity. It is a shocking fact that should have awakened humanity to the realization that something is dreadfully wrong.

Mankind is always prey to its own "exuberance," to use Catton’s term. That has certainly been true of population growth. In many cultures, "Do you have any children?" or, "How many children do you have?" is a form of greeting or civility almost equivalent to "How do you do?" or, "Nice to meet you." World population growth, nevertheless, has always been ecologically hazardous. With every increase in human numbers we are only barely able to keep up with the demand: providing all those people with food and water has not been easy. We are always pushing ourselves to the limits of Earth’s ability to hold us (Catton, 1982).


Even that is an understatement. No matter how much we depleted our resources, there was always the sense that we could somehow "get by." But in the late twentieth century we stopped getting by. It is important to differentiate between production in an "absolute" sense and production "per capita." Although oil production, in "absolute" numbers, kept climbing -- only to decline in the early twenty-first century -- what was ignored was that although that "absolute" production was climbing, the production "per capita" reached its peak in 1979 (BP, annual).

The unequal distribution of resources plays a part. The average inhabitant of the US consumes far more than the average inhabitant of India or China. Nevertheless, if all the world’s resources were evenly distributed, the result would only be universal poverty. It is the totals and the averages of resources that we must deal with in order to determine the totals and averages of results. For example, if all of the world’s arable land were distributed evenly, in the absence of mechanized agriculture each person on the planet would still have an inadequate amount of farmland for survival: distribution would have accomplished very little.

We were always scraping the edges of the earth, but we are now entering a far more dangerous era. The main point to keep in mind is that, throughout the twentieth century, while population was going up, so was oil production. Future excess mortality can therefore be determined -- at least in a rough-and-ready manner -- by the fact that in modern industrial society it is largely the oil supply that determines how many people can be fed.


There is no precise causal relation, of course, between oil production and famine. To suggest such a thing would conflict with other ways of estimating future population. Another figure, closely related, might be the ratio of population to arable land. Even then, the history of famine does not suggest an exact correlation between population and arable land; certainly in the 1950s there were major famines although the world population was only a third of that today. Ó Gráda claims that the worst famines in recent times were actually in countries which rate relatively well in terms of the ratio of population to arable: Angola, Ethiopia, Somalia, Mozambique, Afghanistan, and Sudan. In fact famine, at least up to the present time, seems to have been more related to politics than to arable land or other resources.


Famine will also cause a lowering of the birth rate (Devereux, 2000; Ó Gráda, 2007, March). This will sometimes happen voluntarily, as people realize they lack the resources to raise children, or it will happen involuntarily when famine and general ill health result in infertility. In most famines the number of deaths from starvation or from starvation-induced disease is very roughly the same as the number of lost or averted births. In Ireland’s nineteenth-century famine, the number of famine deaths was 1.3 million, whereas the number of lost births was 0.4 million. The number of famine deaths during China’s Great Leap Forward (1958-1961), however, was perhaps 30 million, and the number of lost births was perhaps 33 million.

The "normal," non-famine-related, birth and death rates are not a factor in determining the future population figures, since for most of pre-industrial human history the sum of the birth and death rates -- in other words, the growth rate -- has been nearly zero: 2,000 years ago the global population was about 300 million, and it took 1,600 years for the population to double. If not for the problem of resource-depletion, in other words, the future birth rate and death rate would be nearly identical, as they were in pre-industrial times. (And there is no question that the future will mean a return to the "pre-industrial.")


Nevertheless, it will often be hard to separate "famine deaths" from a rather broad category of "other excess deaths." War, disease, and other factors will have unforeseeable effects of their own. Considering the unusual duration of the coming famine, and with Leningrad (Salisbury, 2003) as one of many precursors, cannibalism may be significant; to what extent should this be included in the calculation of "famine deaths"? In any case, it is probably safe to say that an unusually large decline in the population of a country will be the most significant indicator that this predicted famine has in fact arrived.

We must ignore most previous estimates of future population growth. Instead of a steady rise over the course of this century, as generally predicted, there will be a clash of the two giant forces of overpopulation and oil depletion, followed by a precipitous ride into an unknown future.

We are ill-prepared for the next few years. The problem of oil depletion turns out to be something other than a bit of macabre speculation for people of the distant future to deal with, but rather a sudden catastrophe that will only be studied dispassionately long after the event itself has occurred. Doomsday will be upon us before we have time to look at it carefully.

The world has certainly known some terrible famines in the past. In recent centuries, one of the worst was that of North China in 1876-79, when between 9 and 13 million died, but India had a famine at the same time, with perhaps 5 million deaths. The Soviet Union had famine deaths of about 5 million in 1932-34, purely because of misguided political policies. The worst famine in history was that of China’s Great Leap Forward, 1958-61, when perhaps 30 million died, as mentioned above.

A closer analogy to the coming "petroleum famine" may be Ireland’s potato famine of the 1840s, since -- like petroleum -- it was a single commodity that caused such devastation (Woodham-Smith, 1962). The response of the British government at the time can be summarized as a jumble of incompetence, frustration, and indecision, if not outright genocide, and the same may be true of any future responses by government.


As previously mentioned, population is not tied with mathematical precision to oil production; the latter provides only a rough indication of the former. To some extent, people will learn to live with less. Certainly most westerners can cut their living standards considerably and still live healthy lives -- perhaps even healthier, since they would be eating less and walking more. People will also switch to other sources of energy: in particular, firewood can replace fossil fuels for heating, though the amount of wood will not be sufficient for billions of people. All these adjustments will alleviate matters for a while, although the basic problem will remain: that fossil fuels will decline at a much faster rate than any voluntary reduction in births.

The above predictions can be nothing more than approximate, but even the most elaborate mathematics will not entirely help us to deal with the great number of interacting factors. We need to swing toward a more pessimistic figure for humanity’s future if we include the effects of war, disease, and so on. One of the most serious negative factors will be largely sociological: To what extent can the oil industry maintain the advanced technology required for drilling ever-deeper wells in ever-more-remote places, when that industry will be struggling to survive in a milieu of social chaos? Intricate division of labor, large-scale government, and high-level education will no longer exist. 

On the other hand, there are elements of optimism that may need to be plugged in. We must not forget the sheer tenacity of the human species: we are intelligent social creatures living at the top of the food chain, in the manner of wolves, yet we outnumber wolves worldwide by about a million to one; we are as populous as rats or mice. We can outrace a horse over long distances. Even with Stone-Age technology, we can inhabit almost every environment on Earth, even if most of the required survival skills have been forgotten.

Specifically, we must consider the fact that neither geography nor population is homogeneous. All over the world, there are forgotten pockets of habitable land, much of it abandoned in the modern transition to urbanization, for the ironic reason that city dwellers regarded rural life as too difficult, as they traded their peasant smocks for factory overalls. There are still areas of the planet’s surface that are sparsely occupied although they are habitable or could be made so, to the extent that many rural areas have had a decline in population that is absolute, i.e. not merely relative to another place or time. By careful calculation, therefore, there will be survivors. Over the next few years, human ingenuity must be devoted to an understanding of these geographic and demographic matters, so that at least a few can escape the tribulation. Neither the present nor future generations should have to say,

 "We were never warned." 


Add caption


References:

BP. Global statistical review of world energy. (annual). Retrieved fromhttp://www.bp.com/statisticalreview

Catton, W. R., Jr. (1982). Overshoot: The ecological basis of revolutionary change. Champaign, Illinois: University of Illinois Press.

Devereux, S. (2000). Famine in the twentieth century. IDS Working Paper 105. Retrieved fromhttp://www.sarpn.org.za/documents/d0000076/Devereux.pdf

Ó Gráda, C. (2007, March). Making famine history. Journal of Economic Literature. Retrieved from http://www.ucd.ie/economics/research/papers/2006/WP06.10.pdf

Pimentel, D. (1984). Energy flows in agricultural and natural ecosystems. CIHEAM (International Centre for Advanced Mediterranean Agronomic Studies). Retrieved fromhttp://www.ressources.ciheam.org/om/pdf/s07/c10841.pdf

------, & Hall, C. W., eds. (1984). Food and energy resources. Orlando, Florida: Academic Press.

------, & Pimentel, M. H. (2007). Food, energy, and society. 3rd ed. Boca Raton, Florida: CRC Press.

Salisbury, H. E. (2003). The 900 days: The siege of Leningrad. Cambridge, Massachusetts: Da Capo Press.

Woodham-Smith, C. (1962). The great hunger: Ireland 1845-1849. New York and Evanston: Harper & Row.

Tuesday 16 February 2016

Big Declines Bakken Production


Bakken December Data, Big Decline


Image result for the bakken

The Bakken and North Dakota tight oil production data is out.

Bakken production was down 28,604 barrels per day to 1,096,044 bpd. All North Dakota was down 29,506 bpd to 1,152,280 bpd.

This is just the last two years of the chart above. It gives a slightly better look at what is happening.
Bakken BPD per Well
Barrels per day per well fell to 106 in the Bakken and to 90 in all North Dakota.

From the Director’s Cut

Producing Wells

November 13,100

December 13,119 (preliminary)(all time high was Oct 2015 13,190)
10,756 wells or 82% are now unconventional Bakken–Three forks wells
2,363 wells or 18% produce from legacy conventional pools.
 –
Permitting

November 125 drilling and 0 seismic
December 95 drilling and 0 seismic
January 78 drilling and 0 seismic (all time high was 370 in 10/2012)
 –
ND Sweet Crude Price

November $32.16/barrel
December $27.57/barrel
January $21.13/barrel
Today’s $16.50/barrel
(lowest since February 2002)(all-time high was $136.29 7/3/2008)
 –
Rig Count

November 64
December 64
January 52
Today’s rig count is 41 (lowest since July 2009 when it was 40)(all-time high was 218 on 5/29/2012)
The statewide rig count is down 81% from the high and in the five most active counties rig count is down as follows:
Divide  -85% (high was 3/2013)
Dunn -76% (high was 6/2012)
McKenzie -75% (high was 1/2014)
Mountrail -88% (high was 6/2011)
Williams -90% (high was 10/2014)


  A Final Note :  

The drilling rig count was steady from November to December, fell sharply from December to January, and again into this month. Operators are now even more committed to running fewer rigs as oil prices remain at very low levels. The number of well completions remained steady from 77(final) in November to 76(preliminary) in December. Oil price weakness is now anticipated to last into at least the third quarter of this year and is the main reason for the continued slow-down. There were no significant precipitation events, 5 days with wind speeds in excess of 35 mph (too high for completion work), and 2 days in Williston with temperatures below -10F.

Over 97% of drilling now targets the Bakken and Three Forks formations.
At the end of December there were an estimated 945 wells waiting on completion services 2, 24 less than at the end of November.
Crude oil take away capacity remains dependent on rail deliveries to coastal refineries to remain adequate.

The drop in oil price associated with anticipation of lifting sanctions on Iran and a weaker economy in China is expected to lead to further cuts in the drilling rig count. Utilization rate for rigs capable of 20,000+ feet is about 30% and for shallow well rigs (7,000 feet or less) about 20%.
Drilling permit activity declined November to December then fell further in January as operators continue to position themselves for low 2016 price scenarios. Operators have a significant permit inventory should a return to the drilling price point occur in the next 12 months.


Free Logo From Thefreelogomakers.com


Dream, Believe, Inspire