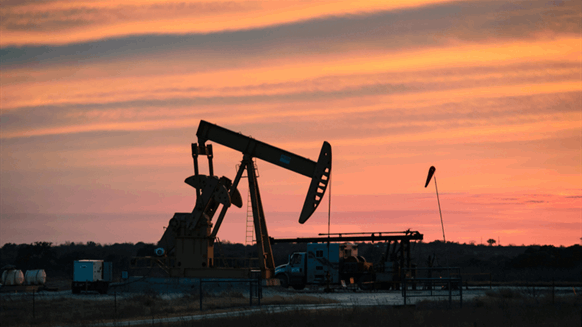
"The energy sector has made up almost a quarter of all U.S. bankruptcies in the past year"

Shale Patch Struggles 5 Years After Crude Collapse
by Bloomberg
|
Rachel Adams-Heard
|
Bloomberg) -- It’s been five years since crude started a precipitous drop that eventually saw it hit a low of $26 a barrel. While prices have recovered some of the lost ground, shale producers are still feeling the pain.
Oil’s 76% collapse from almost $108 a barrel in June 2014 was the worst plunge since the financial crisis of 2008. Below are some data points on how the industry has fared since.
In 2014, oil and gas companies made up almost 11% of the S&P 500 Index. Now, that’s just over 5% as some investors appear to have given up on the sector.

Shareholder antipathy stems at least in part from questions over the profitability of shale drilling. While the five big, publicly traded integrated major producers -- BP Plc, Chevron Corp., Exxon Mobil Corp., Royal Dutch Shell Plc and Total SA -- resumed generating free cash flow as a group in 2017, independent U.S. drillers only became cash-flow-positive (based on an average of 12 such companies compiled by Bloomberg) in 2018 -- and they were back in the red in the first quarter of 2019.
LEARN MORE
OIL: BOOM OR BUST
