

World Energy Consumption Since 1820 in Charts
By
Figure 1 (above) shows the huge increase in world energy consumption that has taken place in roughly the last 200 years. This rise in energy consumption is primarily from increased fossil fuel use. Below is the population increase.

With energy consumption rising as rapidly as shown in Figure 1, it is hard to see what is happening when viewed at the level of the individual. To get a different view, Figure 3 shows average consumption per person, using world population estimates by Angus Maddison.
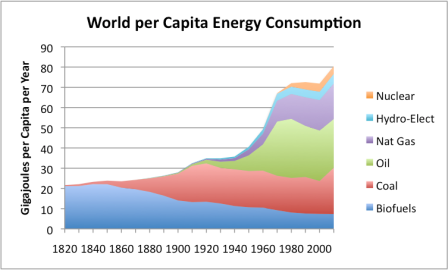
On a per capita basis, there is a huge spurt of growth between World War II and 1970. There is also a small spurt about the time of World War I, and a new spurt in growth recently, as a result of growing coal usage in Asia.
LEARN MORE
POPULATION GROWTH IS UNSUSTAINABLE