

Global Oil Supply in 2023
Before sharing our expectations for oil production in 2023, we would like to remind our readers of four fundamental concepts which are important for a better understanding of the supply side of the oil market:
There is a difference between “production” and “supply”. Oil in the SPR is oil produced in past years. Releasing oil from the SPR is an increase in supply. A reduction in commercial oil inventories to meet demand implies supplies are higher than production.
There is a difference between “actual OPEC production” and the “Call on OPEC”. The first is actual production, while the second is what OPEC should produce to fill the gap between global oil demand and non-OPEC production. Actual production could be higher, lower, or equal to the Call on OPEC.
There is a difference between the OPEC+ production ceiling (quota or production target) and actual production. OPEC+ production decisions focus on the production ceiling, not actual production. A case in point is when OPEC+ decided in early October 2022 to cut production by 2 mb/d—this was from the production ceiling. The actual production cut was way lower since many countries could not meet their quotas in 2022.
Demand numbers include all liquids: crude, condensate, NGLs, refinery gains, and biofuels. Most production numbers focus on crude and lease condensates. One of the emerging problems now is that crude oil production numbers include NGLs.
Overview of Supply Forecasts
Non-OPEC liquids supply is expected to increase, and it will mostly originate from the US, Norway, Brazil, Canada, Kazakhstan, and Guyana. The Call on OPEC is also expected to increase, but the OPEC actual production may be different from the Call on OPEC, leading to changes in inventories.
Table (3) below shows the various liquids supply forecasts for 2023. The first row indicates growth in non-OPEC supply using data from different organizations, in addition to our own forecast as the EOA. The growth ranges from the low of 690,000 b/d estimated by the EIA to the high of 1.59 mb/d forecasted by OPEC. In our turn, we expect non-OPEC supply to grow by 1.27 mb/d. The high number estimated by OPEC shows that the group is not taking any chances and is assuming the worst scenario: a major increase in non-OPEC supply. The low numbers of the EIA and IEA also signal that the two are not taking any chances and want to show that OPEC+ needs to increase production to avoid a large inventory draw.
While the fourth row is intended to show the “Call on OPEC”, such numbers need to be interpreted carefully. For example, the IEA expects the difference between total world demand and non-OPEC production to stand at around 1 mb/d. So, how will this gap be filled? There are three possibilities:
The total gap will be filled by OPEC. OPEC production in this case would increase by 1 mb/d (this is actual production, not ceiling or quota).
If OPEC is not able to increase production by the whole amount, then the rest of the gap will be filled by withdrawals from commercial inventories, and probably SPRs. For example, if OPEC increases production by only 700,000 b/d, then the draw from inventories and SPRs would be 300,000 b/d.
If the gap is larger than the increase in OPEC production and the draw from inventories, prices will rise high enough to reduce demand. For example, the IEA would end up lowering its demand estimates from the stated 101.64 mb/d.
But what if non-OPEC producers failed to deliver the estimated production? In this case, the gap between world demand and non-OPEC production will grow larger, and the demand for OPEC’s oil will increase. In the case OPEC also couldn’t deliver the required amount, there will be withdrawals from inventories. If the difference is large and prices rise significantly, governments of top oil-consuming countries may return to withdrawals from their SPRs.
Our view is that the amount that could be released from both the “Call on OPEC” (what OPEC should produce to fill the gap between global oil demand and non-OPEC production) and inventories will be small: 480,000 b/d. We believe that OPEC will produce above the Call on OPEC (whatever that level is, since these numbers change frequently). This will allow for inventory build, mostly in the first half of the year. In short, there is enough spare capacity in some OPEC countries that can cover any demand increase in 2023, but it will be thin in the fourth quarter.
Table (3)
2023 Non-OPEC Production and Call on OPEC

Source: EIA, 2022, EOA, 2023, IEA, 2022. And OPEC, 2022.
Figures (2) and (3) sum up the forecasts for non-OPEC production and the Call on OPEC on a quarterly basis. They all show that production would respond to higher demand in the second half of 2023.
Figure (2)

Figure (3)
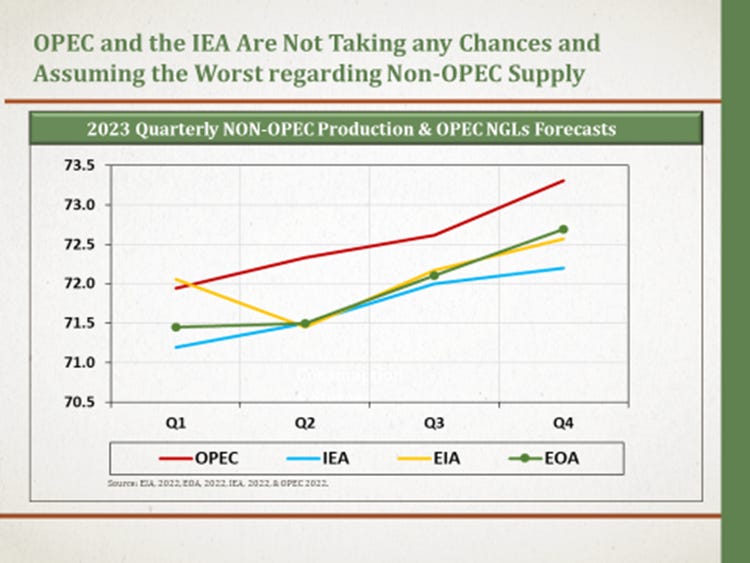
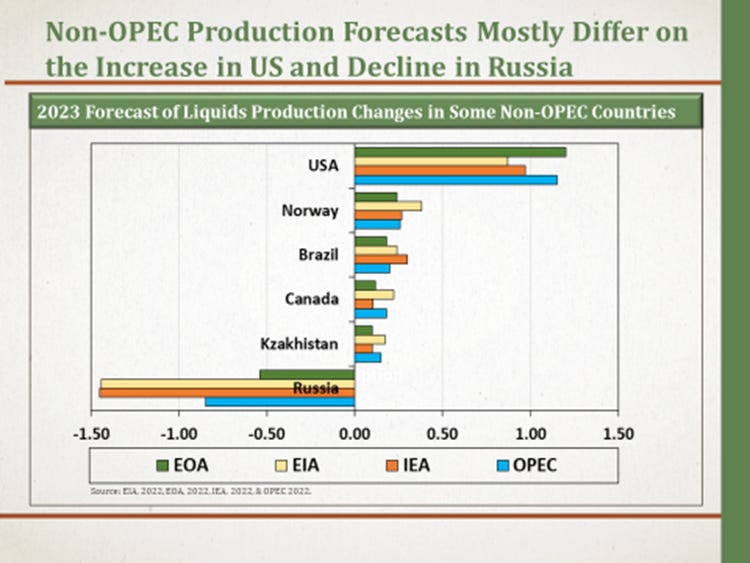
Figure (4) below shows the origins of most production increases based on different forecasts. Our forecasts differ from others in two major ways: First, regarding US oil additions, our forecast is higher than others. Second, and with respect to the decline in Russian oil production, our forecast is way lower than other predictions. It is also worth noting that OPEC’s estimate of the drop in Russian oil output also includes production cuts agreed on by OPEC+ members last October.
MORE NON-OPEC PRODUTION DATA
Figure (4)
No comments:
Post a Comment