
International Rig Count Still Falling

The rig count data in all charts below is through February 2016.
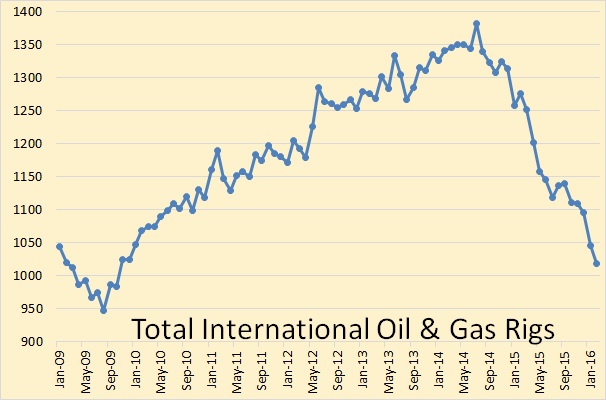
The Baker Hughes International Rig Count does not include the US, Canada, any of the FSU countries or inland China. It does include offshore China. That rig count peaked in July 2014 at 1,382 rigs and in February stood at 1,018, down 364 rigs from the peak.
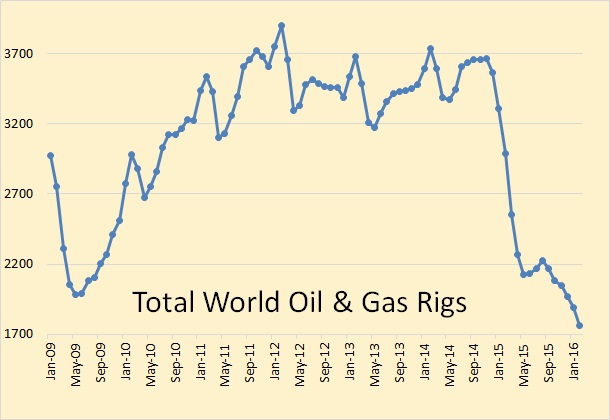
The Baker Hughes total world rig count does include US and Canada but not the FSU or inland China. That total oil & gas rig count stood at 1761 in February, down 52% since December of 2014.
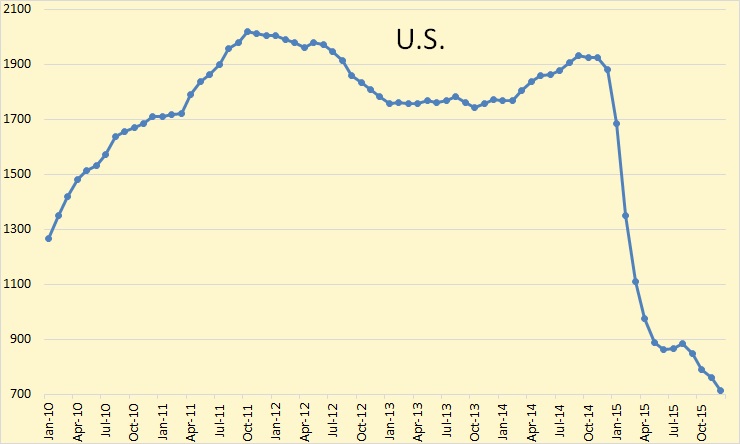
The US monthly total rig count stood at 532 in February, down 72% from November 2014.
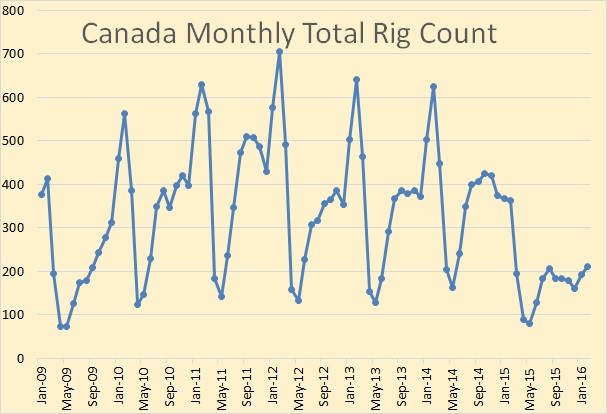
The Canadian total rig count usually peaks in February. It did not in 2015 but stood at 211 this February which will likely be the peak for 2016. That count is down from 626 rigs in February 2014, down over 66%. That was the last pre-price crash February peak.
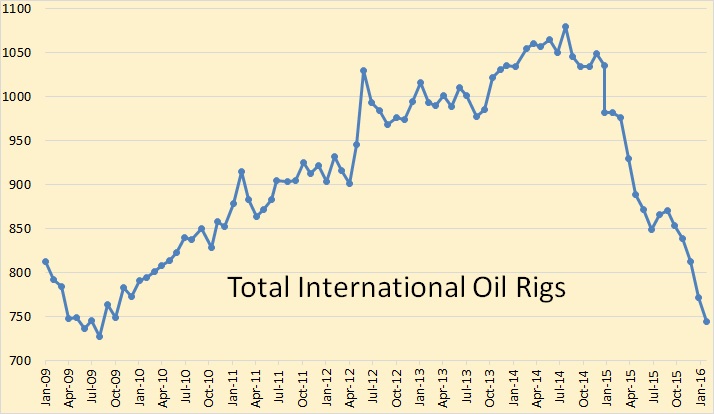

Looking at oil rigs only, total international oil rigs dropped another 28 rigs in February to 744 rigs. That is down 336 rigs or 32% since the July 2014 peak.
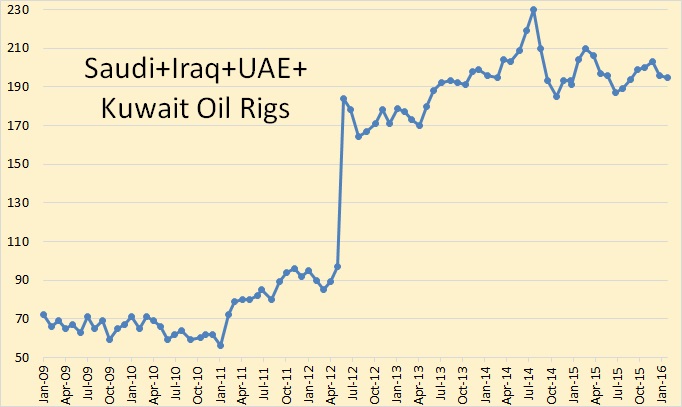
Four nations where the rig count has not collapsed is Saudi Arabia, the UAE and Kuwait and Iraq. The huge jump you see in June 2012 was due to Iraq going from 0 rigs to 78 rigs.
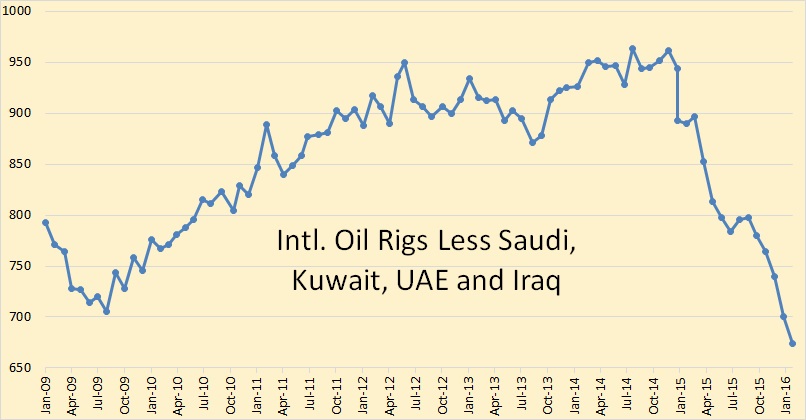
International oil rigs, less Saudi, UAE, Kuwait and Iraq peaked in July 2014 and have declined 30% since that date.
But what has all this done for production… so far.
The production data, right axis, in the above chart is only through December while the rig data, left axis, is through February. Production fell all through the rise in rig count then began to plateau in mid 2013. The rising rig count did not increase production but the falling rig count will almost certainly cause it to decline… after a delay of one to two years of course.
Again, the above oil rig only charts does not include the US, Canada, any FSU nation or China.
Source:
No comments:
Post a Comment