Top Stories
Oil Trades Near 10-Month High as Falling U.S. Supplies Trim Glut
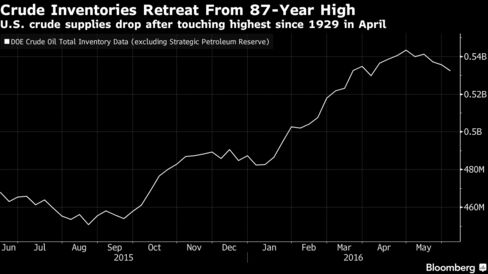
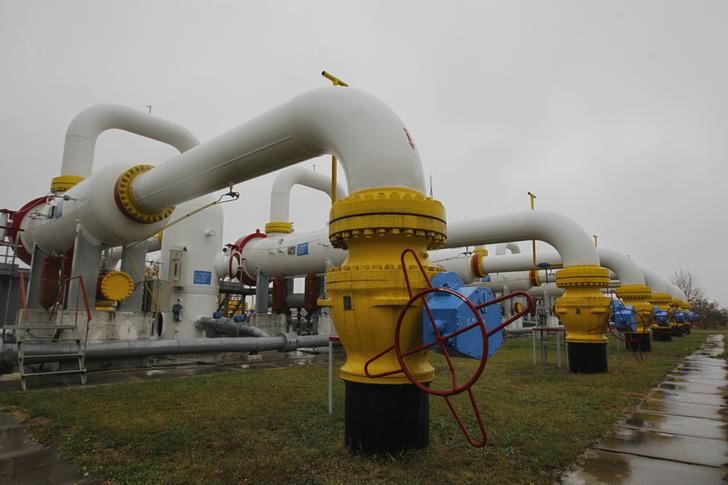
A manifold system, used to direct oil around the facility, stands near crude oil storage tanks stand at the Cushing storage terminal in Cushing. Oil traded near the highest close in more than 10 months as weekly U.S. industry data showed crude stockpiles declined, trimming a glut. Futures were little changed in New York after advancing 3.6 percent the previous two sessions to close above $50 a barrel Tuesday for the first time since July. Inventories fell by 3.57 million barrels last week, the American Petroleum Institute was said to report. Government data Wednesday are forecast to show supplies dropped. Repair work on a key Nigerian oil pipeline operated by Royal Dutch Shell Plc is underway, according to a person familiar with the operations. Oil has surged more than 90 percent from a 12-year low in February amid unplanned disruptions and a steady slide in U.S. output, which is […]
Short-Term Energy Outlook
- Benchmark North Sea Brent crude oil spot prices averaged $47/barrel (b) in May, a $5/b increase from April and the fourth consecutive monthly increase since reaching a 12-year low of $31/b in January. Growing global oil supply disruptions, rising oil demand, and falling U.S. crude oil production contributed to the price increase.
- Brent crude oil prices are forecast to average $43/b in 2016 and $52/b in 2017, $3/b and $1/b higher than forecast in last month’s STEO, respectively. West Texas Intermediate (WTI) crude oil prices are forecast to be slightly lower than Brent in 2016 and to be the same as Brent in 2017. However, the current values of futures and options contracts suggest high uncertainty in the price outlook. For example, EIA’s forecast for the average WTI price in September 2016 of $46/b should be considered in the context of Nymex contract values for September 2016 delivery. These contracts traded during the five-day period ending June 2 (Market Prices and Uncertainty Report) suggest the market expects WTI prices could range from $36/b to $69/b (at the 95% confidence interval) in September 2016.
- During the April-through-September summer driving season of 2016, U.S. regular gasoline retail prices are forecast to average $2.27/gallon (gal), 6 cents/gal higher than forecast in last month’s STEO but 36 cents/gal lower than last summer. U.S. regular gasoline retail prices are forecast to average $2.13/gal in 2016 and $2.27/gal in 2017, which are 5 cents/gal higher and 3 cents/gal higher than forecast in last month’s STEO, respectively.
- U.S. crude oil production averaged 9.4 million barrels per day (b/d) in 2015. Production is forecast to average 8.6 million b/d in 2016 and 8.2 million b/d in 2017, both unchanged from last month’s STEO. EIA estimates that crude oil production for May 2016 averaged 8.7 million b/d, which is more than 0.2 million b/d below the April 2016 level, and approximately 1 million b/d below the 9.7 million b/d level reached in April 2015.
- Natural gas working inventories were 2,907 billion cubic feet (Bcf) on May 27. This level is 32% higher than a year earlier, and 35% higher than the previous five-year (2011-15) average for that week. The natural gas storage injection season typically runs from April through October. EIA projects that natural gas inventories will be 4,161 Bcf at the end of October 2016, which would be the highest end-of-October level on record. Henry Hub spot prices are forecast to average $2.22/million British thermal units (MMBtu) in 2016 and $2.96/MMBtu in 2017, compared with an average of $2.63/MMBtu in 2015.
World Bank downgrades its forecast for 2016 global economy
WASHINGTON (AP) — The World Bank is reducing its forecast for the global economy this year – again. The aid agency now predicts that growth will reach 2.4 percent this year, down from the 2.9 percent it had foreseen in January and unchanged from a tepid 2015. A big problem is that commodity-exporting countries are struggling with low prices for raw materials. The U.S. economy is forecast to grow 1.9 percent, down from 2.4 percent in 2015. The eurozone is expected to grow 1.6 percent, the same as last year. The World Bank slashed its forecast for Japan’s growth to 0.5 percent from the 1.3 percent it expected in January. Its forecast for China remained 6.7 percent. In recent years, the World Bank and International Monetary Fund have consistently downgraded their initial forecasts.
Saudi Arabia Working on First International Bond Sale, Finance Minister Says
Saudi Finance Minister Ibrahim Al-Assaf, pictured March 22 in Riyadh, says Saudi Arabia is ‘now… Saudi Arabia plans to sell bonds for the first time to international investors as the kingdom tackles a widening budget deficit caused by cheap oil, according to the country’s finance minister. “We are now working on issuing international bonds,” Ibrahim Al-Assaf told reporters late Tuesday on the sidelines of a news conference in Jeddah, Saudi Arabia. Saudi Arabia and its oil-exporting neighbors in the Persian Gulf region are increasingly looking to access capital markets as shrinking oil revenue pressures their finances. The Wall Street Journal, citing people familiar with the matter, reported last month that Saudi Arabia was preparing to tap international bond markets sometime this year. The kingdom borrowed $10 billion from a consortium of global banks in April and could raise as much as $15 billion by selling international bonds, some bankers […]
Why Did Natural Gas Prices Just Rise 25% In Two Weeks?
Natural Gas Storage Natural gas prices have run up phenomenally since the June contract expired on 26 May at $1.963/mmBtu. The natural gas prices touched an intraday high of $2.48/mmBtu on 6 June before closing flat for the day. Since October 2015, prices have not been able to cross the strong resistance area of $2.5/mmBtu, as seen in the chart below. Do the fundamentals support a breakout and higher prices in the coming weeks, or will we see a move back into the range? (Click to enlarge) We have to consider supply and demand, along with inventory data to understand whether prices justify their sharp rise, within such a short span of time. Storage (Click to enlarge) Though natural gas storage levels remain elevated, the supply glut is slowing compared to analysts’ expectations. As of 27 May, the Energy Information Administration reported natural gas inventories of 2,907 Billion cubic […]